Rain water has been receded. The North East monsoon is believed to be over, unless there is a sudden change in the BoB climate. Weathermen like IMD Ramanan is preparing for his retirement and Tamilnadu weathermen Pradeep John who was a household name then is slowly forgotten. We can forget everything, but the flood water mark in our walls will keep reminding us about the haunting days.
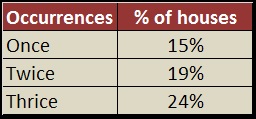
A survey done via social media crowd sourcing revels that about 60% of houses (Ground floor) were invaded by the rain\flood water at least once. Further splitting up this data revels about 24% of houses (Ground) were flooded thrice.
Table- Number of times the rain water occupied your house (ground floor houses in Chennai) during November & December rains.
A middle class family, living in the ground floor had to spend a minimum of 5K-10K on repair or rebuying the lost things. Ramesh, my friend is residing in the ground floor had to endure the water invasion thrice (Nov 13th, Nov 22nd and Dec 1st). Water drained in one day on Nov 13th and 22nd, but on Dec 1st rain/flood it took three days to drain.
Is Chennai so vulnerable, that its rain water drain system couldn’t handle 25 cms of rain in a day?.
No, Ramesh’ house is not in low lying area. Their house was never flooded; he blames at the metro road barricade (road separator) on 100 ft road and the Arumbakkam metro station which is partially built on the Virugambakkam-MMDA canal. He says the metro barricade on the road doesn’t allow the rain water to move across the road (left to right). So when one side of road is over 3 feet of water, the other side had no water logging. In total Ramesh and his family had to spend six days out of their home. He and his family had to stay in their neighbor house which is in the 1st floor. There are lakhs of people like Ramesh who got affected thrice.
December 1st – The Climax
It was once bitten, thrice shy for Chennaities. The December 1st & 2nd rains made everything\one stand still for few days. The below map will show the level (As on Dec 2nd morning) of water logging in the areas marked. Mouse over the mouse pointer will tip you the Feet (ft) – Area name (Ex – “3ft – New Avadi Road”). More information can be obtained by clicking on the location.
If you want to record your data, you can use this form - http://goo.gl/forms/KAjD2fvNyf
To access the cleaned raw data for the below map - Click here
..
** Above image and the map is by the blogger
** All data are crowd sourced via online and not verified physically. Use at your own discretion.

